
- I.Q. Tests
- Scores
- Norms
- Statistics
- Notice
- HRIQ Society

Statistics of Test of Numerical Logic - 1 (TNL1)
Aug. 11, 2015
n=10
The sample number reached 70. We added the origin samples and updated the statistics in the sheet file below. We may update it at times and will not update in this web page any longer.
*Also here's aimage form
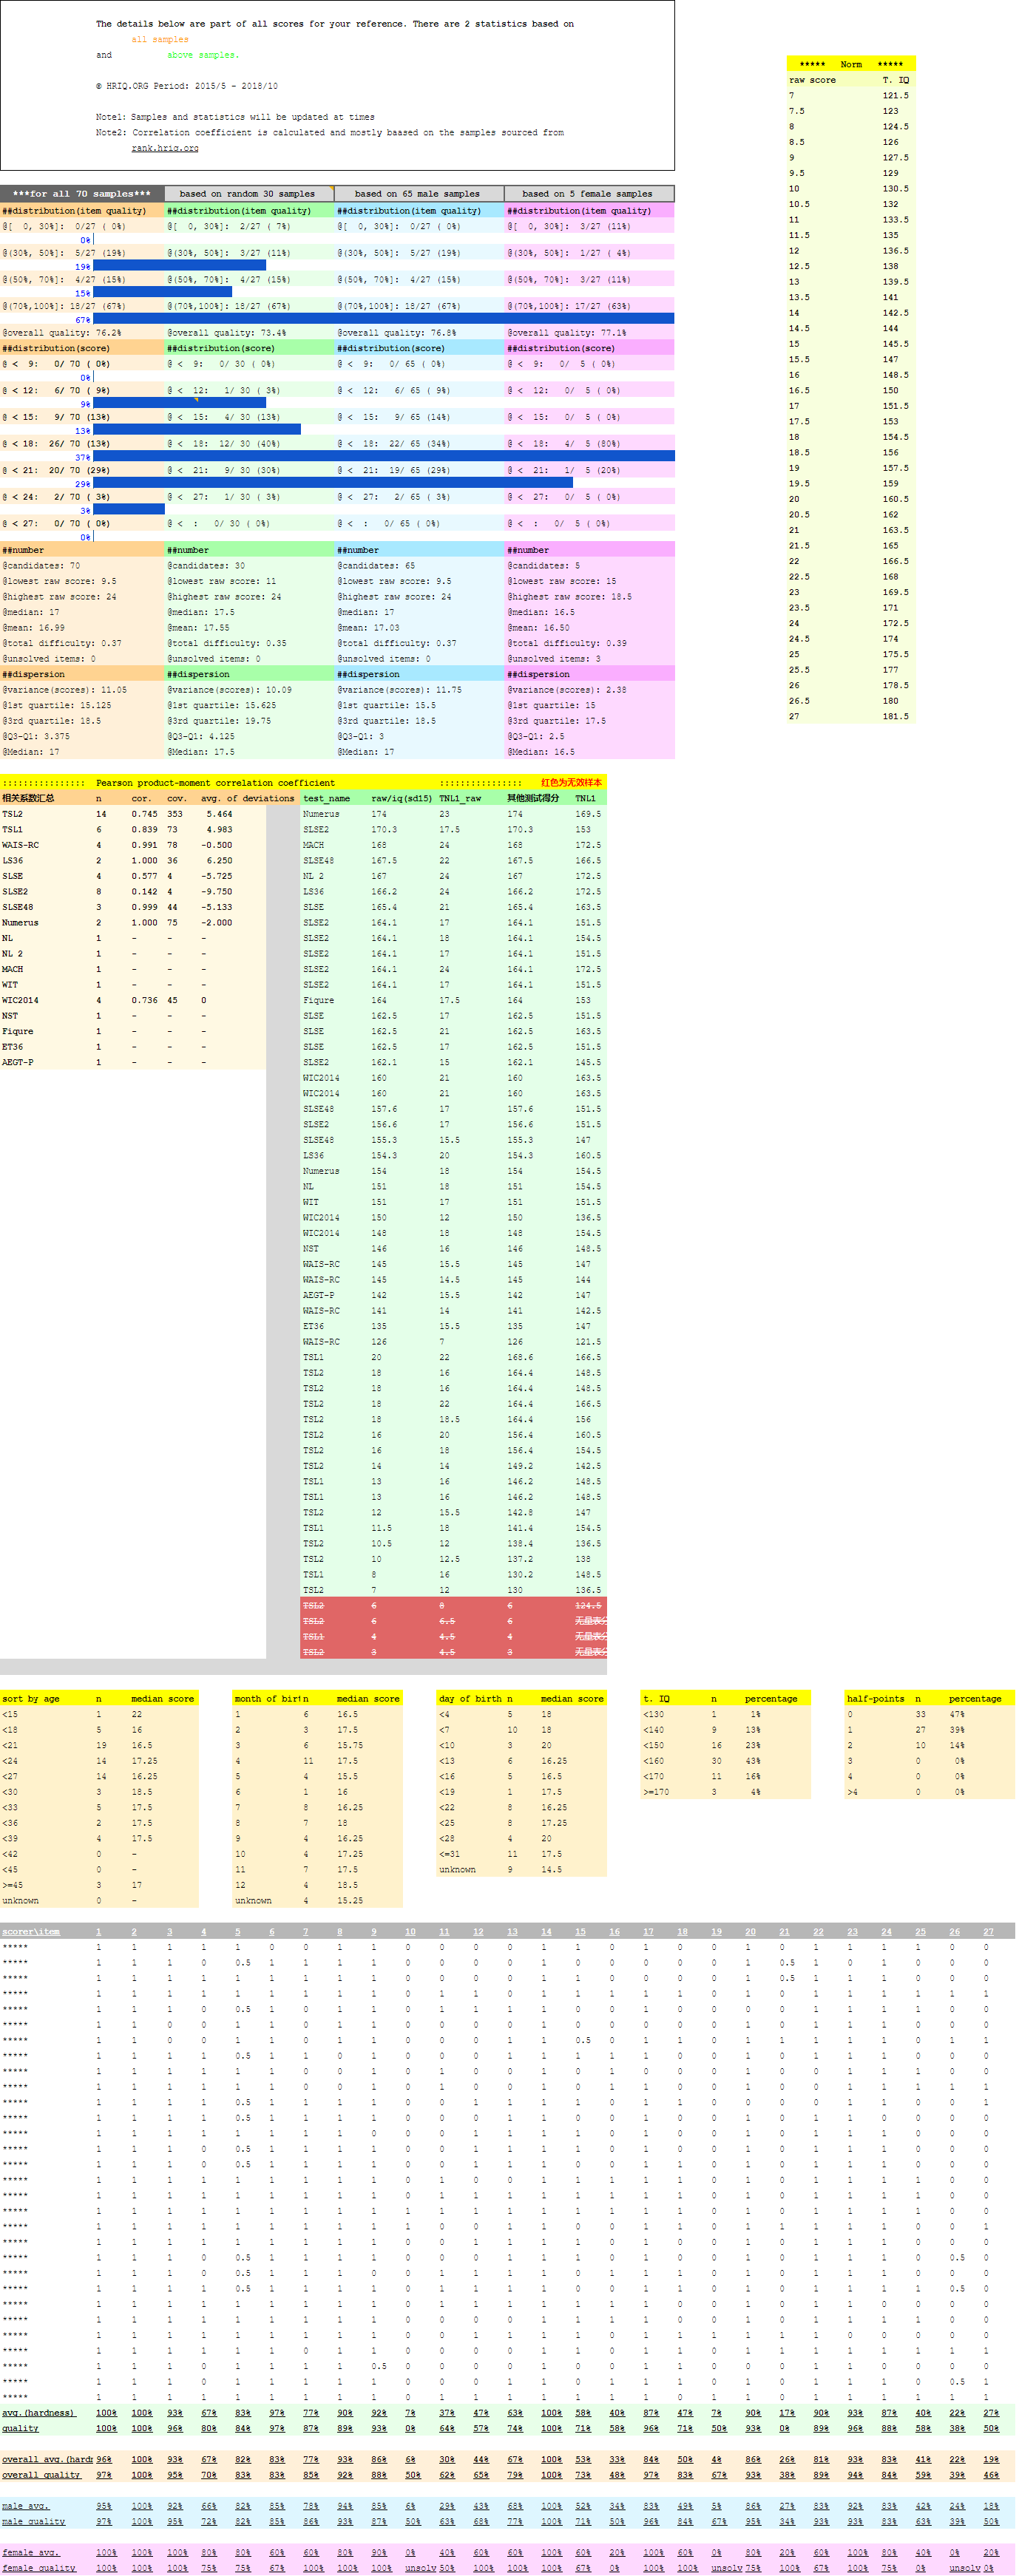
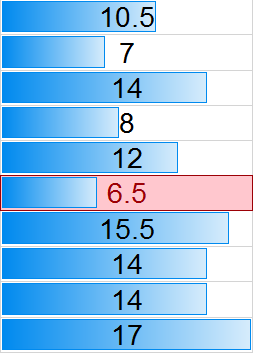
| Scores(↑oldest to ↓newest) | Data statistics | Diagram |
|---|---|---|
 | n = 10 | 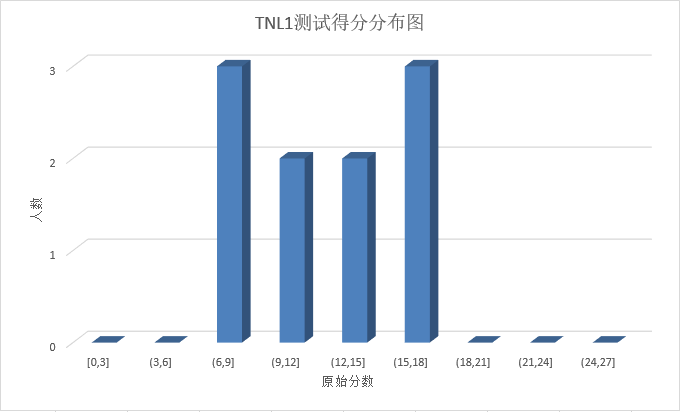 |
| σ = 3.72 | ||
| M = 13 | ||
| Raw scoreMAX = 17 | ||
| μ = 11.85 | ||
| Qd = QU - QL = 14.375 - 7.75 = 6.625 | ||
| hardness = 0.458 | ||
| Second attempt average improvement: 33 % |
| Test name | Effective sample numbern | Correlation coefficient(-1≤rxy≤1) | Type | |||||||||||||
|---|---|---|---|---|---|---|---|---|---|---|---|---|---|---|---|---|
| Wechsler Adult Intelligence Scale - Revised (China) (WAIS-RC) | 3 | 0.992 | Supervised standardized test | |||||||||||||
| ||||||||||||||||
| Test of Spatial Logic - 1 (TSL1) | 1 | - | Unsupervised spatial test | |||||||||||||
| ||||||||||||||||
| Test of Spatial Logic - 2 (TSL2) | 2 | - | Unsupervised spatial test | |||||||||||||
| ||||||||||||||||
| Strict Logic Sequences Examination - Form I (SLSE-I) | 1 | - | Unsupervised numerical test | |||||||||||||
| ||||||||||||||||